Nuances and Principle Relating to Geology, Mineral Exploration and Mineral Extraction Industry
The descriptions and principles expressed are intended to help the pubic recognize the nuances that that impact the geology of mineral deposits, mineral exploration, mining and milling processes. It is directed to people ranging from casual interest, experienced enthusiast and geologist and technicians. Many of the ideas and principles were learned or developed in the school of hard knocks. It is my sincere hope that most readers will find parts of this informative, interesting and possibly beneficial.
Much of the material presented is not normally available in the common literature. Some of the principles are exotic and some is counter intuitive to established thought. The intent is to introduce a wide range of ideas. Some of the applications are narrow niche concepts that apply well in certain situations and not others.
Traditional Precious Metal Assaying
Prospectors, exploration and mining companies assay rocks for gold, silver or platinum group metals. The rock samples including drill core are sent to laboratories for fire assays that determine their precious metal content. The assayer reports the assay as grams Au or Ag per metric ton of rock. One gram per metric ton and 1 ppm are the same amount.
On request labs will report grades by the older standard: Troy oz per short ton (2000 pounds).
1 Troy ounce per short ton = 34.2857 g/metric ton
1 gram/metric Ton = 0.0291666 Troy ounce per short ton
Rocks and diamond drill core are prepared for assaying by crushing the entire rock to coarse sand size of approximately two millimeters. The lab separates approximately 300-400 grams which is pulverized this to a fine rock flour called pulp. The coarse fraction not pulverized is call the reject. The lab then separates a 30 or 15 gram aliquot (preferably 30 grams) of this rock flour. This aliquot is assayed in a fire assay furnace. In the old days a 29.166 gram aliquot (called an assay ton) was used to facilitate easy conversion to Troy ounces/ton.
The aliquot of rock flour is mixed with fluxes and litharge (lead oxide), then the mixture is poured into a cup called a crucible. The mixture is melted forming a liquid glass called slag. The flux is required to cause the rock to melt, releasing the precious metals. The metallic lead dissolves the precious metals from the slag and settles to the bottom of the crucible as a lead button. This lead button contains the precious metals including gold, silver and platinum group metals.
The lead button is melted in a porous cup called a cupel. The cupel absorbs the lead leaving a round bead of precious metals. This bead is then analyzed to determine its precious metal content. This analysis is commonly done by Atomic Absorption (AA).
Labs return the pulps and rejects to their clients or store these at a set cost. Clients commonly keep the rejects six to twelve months and keep the pulps for a long time.
Nugget Effect in Assay Samples including Core Samples
Precious metals commonly occur as nuggets within the host rock. Commonly a 1 kilogram sample may have a few nuggets. If a kilogram sample has one nugget of gold, a 30 gram assay sample has a 3% probability of containing that nugget. The other thirty three assay aliquots will contain no gold.
More commonly a few nuggets of gold are present with the biggest nugget containing a disproportionate amount of gold. If repeat assays are performed on a nuggety sample, the assays will be different and the difference can be extreme. The coarser the gold the more extreme the nugget effect. Many labs routinely perform a couple of repeat assays as part of their quality assurance program. Some labs perform extra repeat assay on anomalously high values. Clients can expect a delay in receiving assay certificates if the lab performs repeat assays.
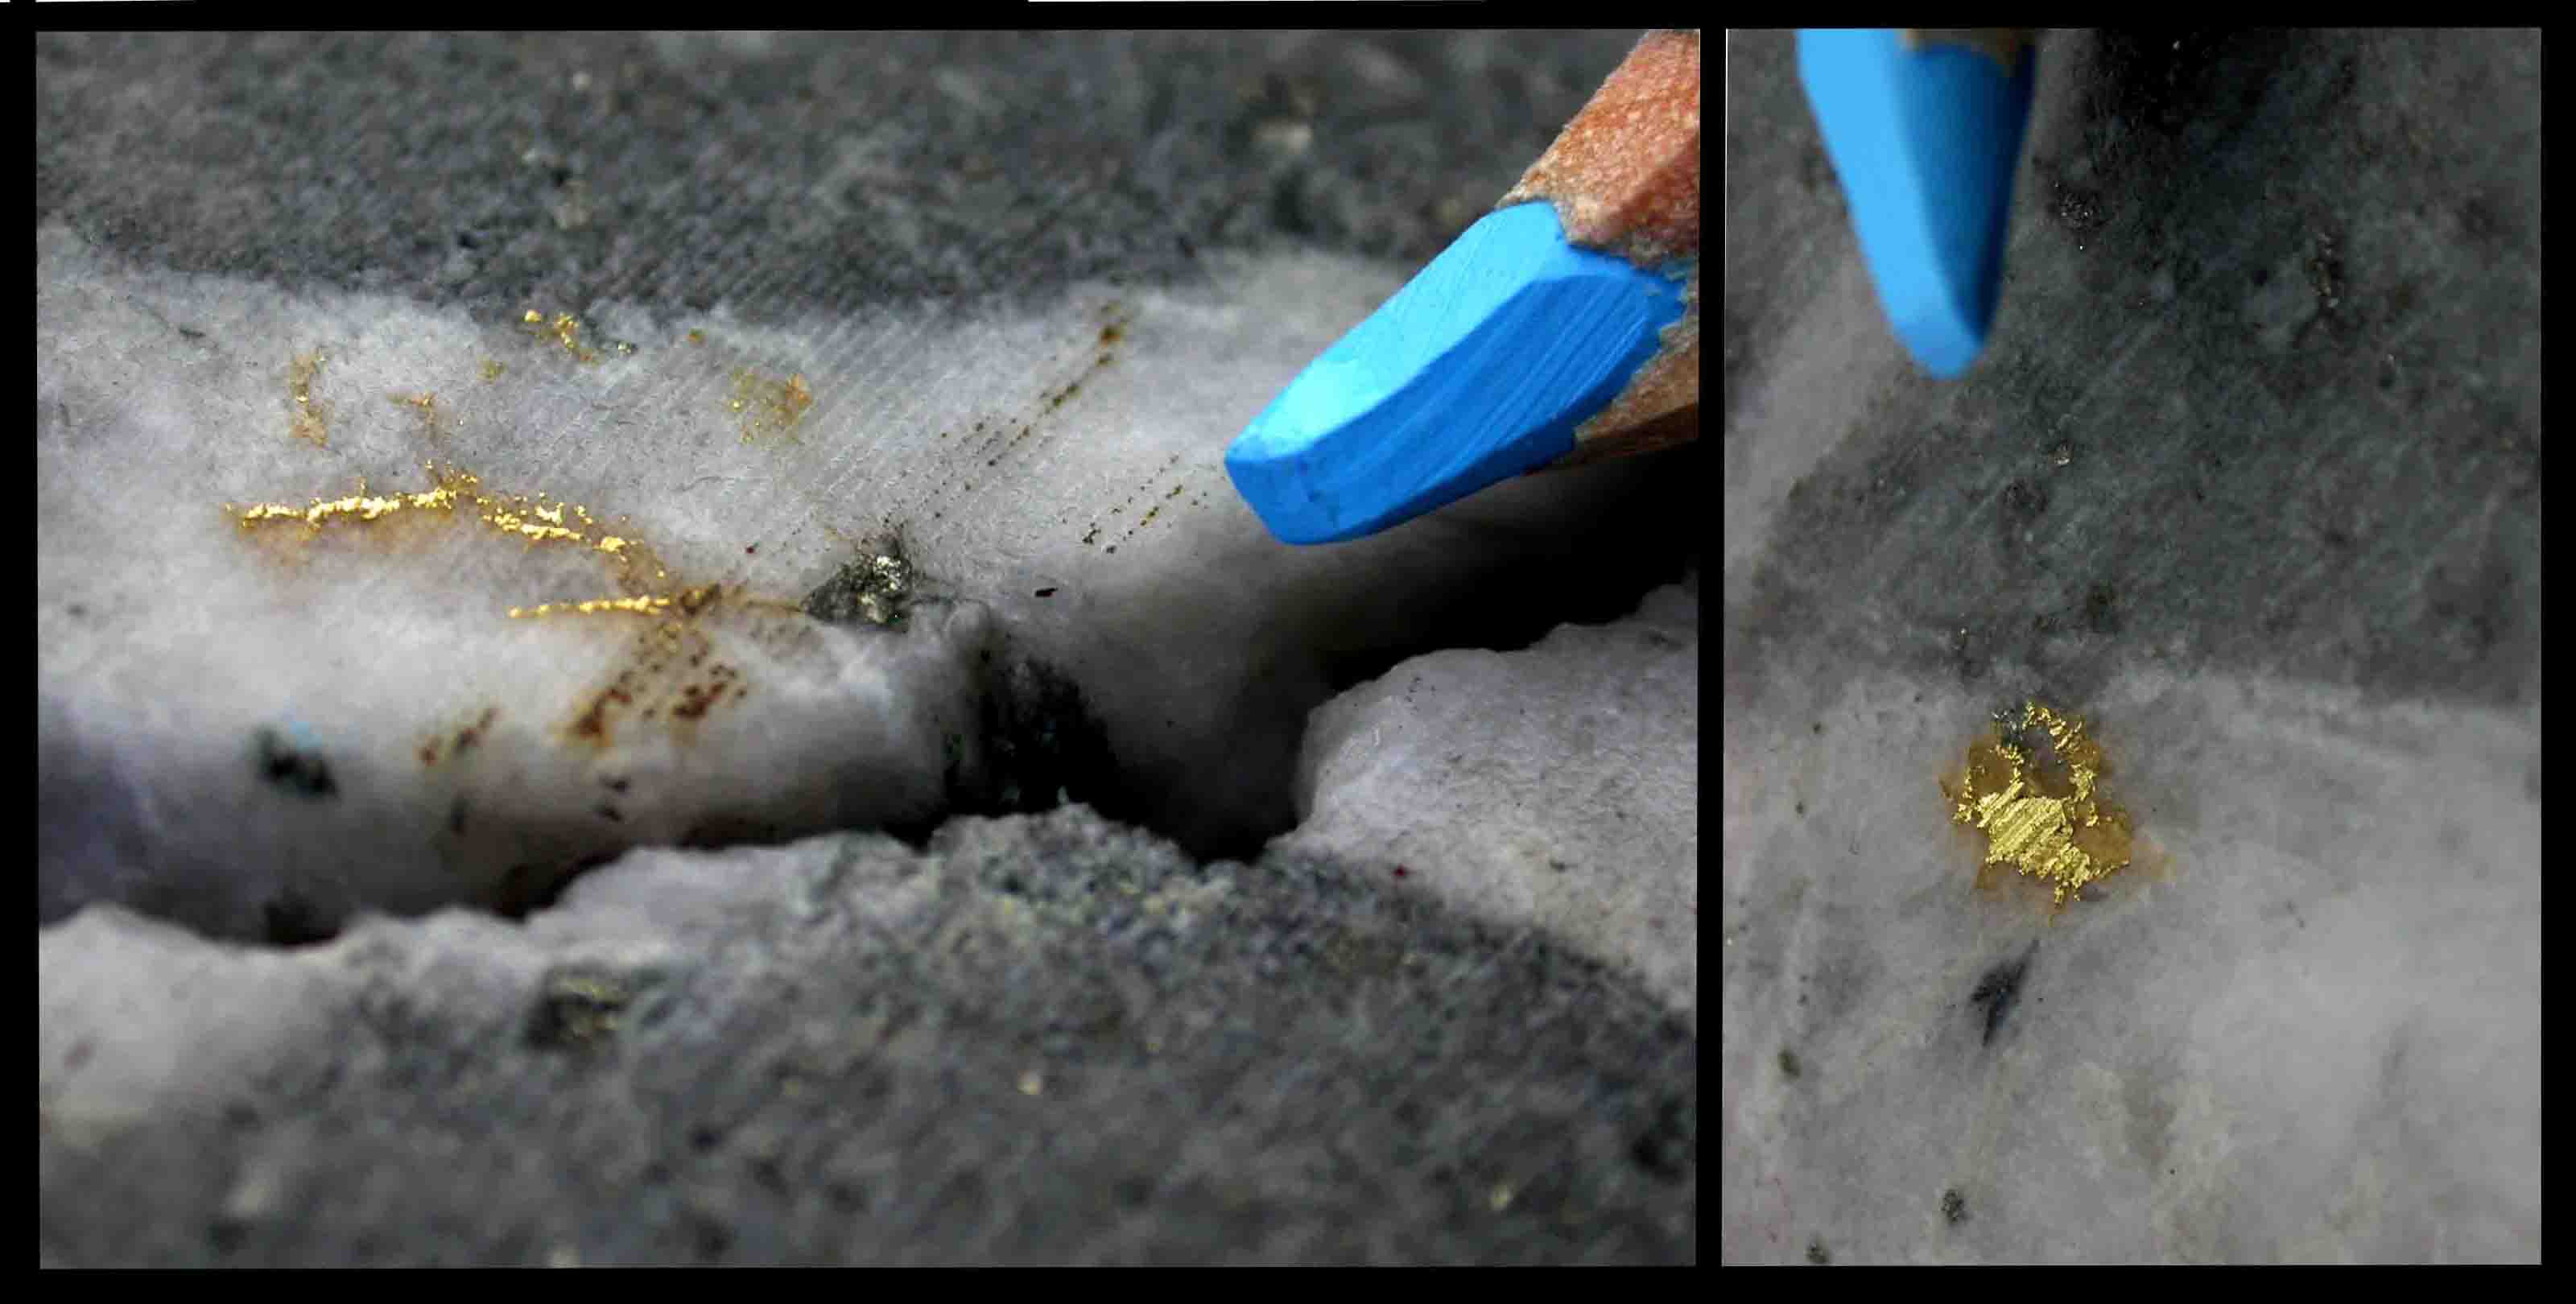
Picture Above: This picture shows typical gold nuggets in diamond drill core. This gold is from the case study tabulated below.
Total Pulp Metallic Assaying
The mineral industry deals with nugget effect in a process called Total Pulp Metallic Assaying. This process is called total pulp because the entire sample is pulverized into a fine pulp and the coarse gold nuggets are screened from the pulp. The entire coarse fraction containing the nuggets is assayed and the fine pulp is typically assayed twice or three times.
The assay of the pulp is the numeric average of the repeated assay of that pulp. For example: repeat assays of 22.95, 23.45 and 24.04 gAu/mT average of 23.48 gAu/mT.
If a Total Pulp Metallic Assay is performed on a 1.000kg sample produces a 980 grams of pulp with an average grade of 23.48 g/mT and the 20 gram of screened metallic fraction grade 1,000 g/mT the weighted average grade of the sample is 43.01 g/mT. This calculation is shown in the chart below.
|
grams
|
gAu/mT
|
g*g/mT
|
|
|
|
20
|
1000.00
|
20000
|
Coarse Metallic
|
|
980
|
23.48
|
23010
|
Fine pulp
|
|
1000
|
43.01
|
43010
|
Total Pulp Metallic
|
The true Total Pulp Metallic Assay is then calculated as the weighted average of the coarse screen fraction assay and the averaged pulp assay. In this example the Total Pulp Metallic Assay of the core is 43.01 gAu/mT.
Case Study Standard Assays & Total Pulp Metallic Assays
The table below is a case study of 57 consecutive Au samples cut from a 51.65 meter continuous core length. These are actual assays, in real core, over actual core lengths. The core was pieced together matching each piece with the piece above and below and placing the pieces in the core boxes in the some orientation. A cut line was established to assure each piece of core was cut in the same orientation. This assured the same side of the core was consistently sampled. This piecing matching was continued between core rows (1.4m average interval). The apparent concentration of gold on the split surface was approximately equivalent to the distribution on the exterior of the core.
There were more than 30 sighting of coarse visible gold with a maximum nugget size of approximately 1 millimeter. Commonly a gold sighting would consist of one or more 0.3-1.0 mm gold grains with additional gold grains diminishing to barely visible. In normal 30 gram aliquot assaying a gold sighting would be crushed into one to two mm fragments prior to pulverizing the pulp. Many of the nuggets probably stayed in the rejects and were recovered and assayed in the Total Pulp Metallic Assay process.
Each core sample was initially assayed as 30 gram aliquot assays to facilitate quick evaluation of the exploration program. The core was then Total Pulp Metallic Assayed to determine the true grade of each sample and the true grade of the 51.67 meter intersection. The lab performed 13 routine repeat (check) assays. The check assays confirmed a moderate to strong nugget effect.
In theory: the weighted average of the 57 Total Pulp Metallic Assay should be approximately equal to the weighted average of the regular assays, Also, the individual Total Pulp Metallic Assay should be significantly different from the regular assays.
In fact: the weighted average of 57 Total Pulp Metallic Assay is 20.57 gAu/mT compared to the weighted Average grade of the regular assays is 20.32 gAu/mT. The Total Pulp Metallic Assay rendered an apparent 1.23% increase in gold content.
This study indicates it is unlikely traditional 30 gm aliquot assaying would produce a very low grade assay in well mineralized core. However, serious errors could occur if an intersection consists of 1 5 samples with a strong nugget effect.
| |
|
|
|
|
|
|
Total
|
|
| |
|
|
|
|
30g
aliquot
|
Au
Check
|
Metallic
|
|
| |
From
|
To
|
Length
|
|
Au
g/mT
|
Au
g/mT
|
Au
g/mT
|
Difference
|
|
1
|
231.31
|
232.32
|
1.01
|
m
|
3.19
|
|
2.91
|
-0.28
|
|
2
|
232.32
|
233.43
|
1.11
|
m
|
5.86
|
|
6.23
|
0.37
|
|
3
|
233.43
|
233.81
|
0.38
|
m
|
12.10
|
|
12.46
|
0.36
|
|
4
|
233.81
|
234.83
|
1.02
|
m
|
63.09
|
64.25
|
55.73
|
-7.36
|
|
5
|
234.83
|
235.44
|
0.61
|
m
|
124.97
|
164.92
|
117.16
|
-7.81
|
|
6
|
235.44
|
236.19
|
0.75
|
m
|
404.61
|
425.49
|
444.77
|
40.16
|
|
7
|
236.19
|
236.87
|
0.68
|
m
|
9.60
|
|
12.50
|
2.90
|
|
8
|
236.87
|
237.90
|
1.03
|
m
|
6.93
|
|
6.18
|
-0.75
|
|
9
|
237.90
|
238.96
|
1.06
|
m
|
12.07
|
|
15.36
|
3.29
|
|
10
|
238.96
|
239.38
|
0.42
|
m
|
565.07
|
520.94
|
487.88
|
-77.19
|
|
11
|
239.38
|
240.00
|
0.62
|
m
|
12.00
|
|
10.76
|
-1.24
|
|
12
|
240.00
|
241.07
|
1.07
|
m
|
8.57
|
|
8.94
|
0.37
|
|
13
|
241.07
|
242.03
|
0.96
|
m
|
5.62
|
|
5.83
|
0.21
|
|
14
|
242.03
|
243.00
|
0.97
|
m
|
12.14
|
11.04
|
12.02
|
-0.12
|
|
15
|
243.00
|
243.99
|
0.99
|
m
|
4.66
|
|
9.09
|
4.43
|
|
16
|
243.99
|
244.51
|
0.52
|
m
|
4.29
|
|
4.08
|
-0.21
|
|
17
|
244.51
|
245.27
|
0.76
|
m
|
6.89
|
|
7.12
|
0.23
|
|
18
|
245.27
|
246.00
|
0.73
|
m
|
4.80
|
|
4.63
|
-0.17
|
|
19
|
246.00
|
247.00
|
1.00
|
m
|
3.63
|
|
4.14
|
0.51
|
|
20
|
247.00
|
248.00
|
1.00
|
m
|
5.07
|
|
4.20
|
-0.87
|
|
21
|
248.00
|
249.00
|
1.00
|
m
|
3.98
|
|
3.03
|
-0.95
|
|
22
|
249.00
|
249.98
|
0.98
|
m
|
2.50
|
|
2.74
|
0.24
|
|
23
|
249.98
|
251.04
|
1.06
|
m
|
1.85
|
|
1.98
|
0.13
|
|
24
|
251.04
|
252.00
|
0.96
|
m
|
2.78
|
|
3.47
|
0.69
|
|
25
|
252.00
|
253.00
|
1.00
|
m
|
1.78
|
|
2.08
|
0.30
|
|
26
|
253.00
|
254.00
|
1.00
|
m
|
5.79
|
5.90
|
6.05
|
0.26
|
|
27
|
254.00
|
255.00
|
1.00
|
m
|
3.15
|
|
3.30
|
0.15
|
|
28
|
255.00
|
256.00
|
1.00
|
m
|
2.95
|
|
2.93
|
-0.02
|
|
29
|
256.00
|
257.18
|
1.18
|
m
|
2.22
|
|
1.98
|
-0.24
|
|
30
|
257.18
|
258.00
|
0.82
|
m
|
0.14
|
|
0.17
|
0.03
|
|
31
|
258.00
|
258.73
|
0.73
|
m
|
0.02
|
|
0.03
|
0.01
|
|
32
|
258.73
|
259.66
|
0.93
|
m
|
1.35
|
1.55
|
1.51
|
0.16
|
|
33
|
259.66
|
260.12
|
0.46
|
m
|
12.55
|
|
5.79
|
-6.76
|
|
34
|
260.12
|
261.08
|
0.96
|
m
|
5.73
|
|
5.34
|
-0.39
|
|
35
|
261.08
|
262.04
|
0.96
|
m
|
3.94
|
|
4.10
|
0.16
|
|
36
|
262.04
|
263.19
|
1.15
|
m
|
4.35
|
|
4.69
|
0.34
|
|
37
|
263.19
|
264.00
|
0.81
|
m
|
0.06
|
0.05
|
0.06
|
0.00
|
|
38
|
264.00
|
265.00
|
1.00
|
m
|
0.85
|
|
0.66
|
-0.19
|
|
39
|
265.00
|
266.00
|
1.00
|
m
|
4.77
|
|
4.61
|
-0.16
|
|
40
|
266.00
|
267.00
|
1.00
|
m
|
5.18
|
|
5.61
|
0.43
|
|
41
|
267.00
|
268.00
|
1.00
|
m
|
6.72
|
|
7.76
|
1.04
|
|
42
|
268.00
|
269.00
|
1.00
|
m
|
11.76
|
|
10.55
|
-1.21
|
|
43
|
269.00
|
270.00
|
1.00
|
m
|
6.03
|
|
6.05
|
0.02
|
|
44
|
270.00
|
270.41
|
0.41
|
m
|
6.86
|
|
6.73
|
-0.13
|
|
45
|
270.41
|
271.10
|
0.69
|
m
|
131.04
|
162.24
|
165.98
|
34.94
|
|
46
|
271.10
|
272.00
|
0.90
|
m
|
7.30
|
|
6.45
|
-0.85
|
|
47
|
272.00
|
273.00
|
1.00
|
m
|
9.84
|
11.04
|
10.04
|
0.20
|
|
48
|
273.00
|
274.00
|
1.00
|
m
|
7.82
|
|
8.47
|
0.65
|
|
49
|
274.00
|
274.99
|
0.99
|
m
|
8.43
|
|
8.15
|
-0.28
|
|
50
|
274.99
|
276.00
|
1.01
|
m
|
1.78
|
|
0.67
|
-1.11
|
|
51
|
276.00
|
277.00
|
1.00
|
m
|
7.75
|
|
4.49
|
-3.26
|
|
52
|
277.00
|
278.00
|
1.00
|
m
|
8.78
|
|
8.16
|
-0.62
|
|
53
|
278.00
|
279.00
|
1.00
|
m
|
7.47
|
|
8.02
|
0.55
|
|
54
|
279.00
|
280.00
|
1.00
|
m
|
8.61
|
9.19
|
10.15
|
1.54
|
|
55
|
280.00
|
280.99
|
0.99
|
m
|
9.05
|
8.74
|
9.60
|
0.55
|
|
56
|
280.99
|
282.00
|
1.01
|
m
|
7.13
|
|
8.05
|
0.92
|
|
57
|
282.00
|
282.96
|
0.96
|
m
|
9.02
|
9.43
|
7.92
|
-1.10
|
| |
|
Weighted Average Grade
|
51.65
|
m
|
20.32
|
|
20.57
|
|
Had this intersection consisted of only five consecutive samples; the change of apparent grades would have been much larger and could have seriously impacted mining decisions in outlining cut of grades in mine planning. Understanding nugget effect is important and the importance of Total Pulp Metallic Assaying is important in determining the length of core to be included as ore in resource calculations.
Benefit of Pulverizing the Entire Sample
Much of the benefit of Total Pulp Metallic Assay can be achieved by pulverizing the entire sample and performing a single routine assay. The nugget effect can be additionally reduced by routinely assaying and averaging two assays on the pulp. By routine repeat assaying will verify the impact of the nugget effect.
This is a viable alternative to the expensive and time consuming Total Pulp Metallic Assay process.
Potential Total Pulp Metallic Assay Problems
Some labs appear to report Total Pulp Metallic Assay but only pulverize and screen part of the sample, possibly half of the sample. In reality this is Partial Pulp Metallic Assay and the client will not know this unless the client explicitly asks the question that needs to be asked. Some labs take a shortcut in Total Pulp Metallic Assay and if given a 1km sample, pulverize only the standard 300-400 gram portion and perform Total Pulp Metallic Assay on only part of the core. It is the responsibility of the geologist to confirm the lab is performing a true Total Pulp Metallic Assay.
Some labs only report one assay for the pulps, one assay for the screened metallic and the weighted average grade as a Total Pulp Metallic Assay. This results in a significant loss of valuable free information; to evaluate the distribution of precious metals and to the assist the metallurgist that will be designing the mill circuits.
Bre-X Gold Today, Gone Tomorrow
The Northern Miner press book titled: “Bre-X Gold Today and Gone Tomorrow” is an excellent read documenting the importance knowing and using correct assaying techniques. By performing geostatistics to raw assay values geologists were able to determine the Busang Gold deposit was pure geofiction.
Had that deposit been real, the design of the mill would have required extra caution to recover the coarse gold that would probably not have been amenable to floatation processes. Also: The design of the mill would have had to determine if sufficient coarse gold was present to justify the expense of an extra milling process, probably involving gravity separation.
Much coarse gold probably exists unrecovered in tailings ponds from traditional floatation mills.
Nugget Effect in Mineral Deposits
Ore deposits commonly have localized area of very high grade ore separated by large volumes of lower grade material. Often the lower grade material is marginal or sub-marginal ore grade rock. The location of high grade sections is often random and unpredictable. These high grade concentrations are required for the economically viability of the deposit. The “Envelope of Mineralization” concept is useful tool do deal with these nugget effects in mineral Deposits.
Gold, Silver and diamond deposits commonly have extreme nugget effects. Diamonds are the ultimate nugget effect mineral. A value of diamonds can be restricted to a few large, valuable stones that are easily missed or difficult to evaluate by a diamond drill hole or drill program. Sometime a few individual breccia fragments (xenoliths) of mantle rocks can contain several high quality diamonds. This text does not deal explicitly with diamonds but some of the principles discussed can apply to this extreme scenario.
Envelope of Mineralization
The envelope of alteration commonly is much larger than the economic deposits it hosts. If the alteration and mineral zoning are predictable and zoned relative to the economic mineralization, they become valuable observable aids to locating economic mineral deposits.
Deposits commonly have an envelope of mineralization. This envelope of mineralization is the total volume of the deposit that hosts economic minerals.
A consistent and predictable deposit is relatively easy to evaluate. The deposit is adequately drilled if additional holes are unlikely to change the calculated grade, location or shape of a deposit.
The concept of Envelope of Mineralization is useful in evaluating deposits that have unpredictable grade variability caused by a nugget effect. A few holes can be extremely unreliable for calculation reasonably reliable ore grades. Many holes are required to determine a reliable ore grade of the entire envelope of mineralization. When additional holes within the Envelope of Mineralization have little impact on the calculated grade, location or shape of a deposit, the Envelope of Mineralization is adequately defined.
Separating an envelope of mineralization into ore zones and waste zones introduces statistical errors. The ore zones are consistently lower grade than calculated and the waste is consistently higher grade than calculated. The statistical error is likely to increase as the ratio of waste to ore increases. This has significance if highgrading a deposit is considered.
Nugget Effect in Silver Deposits
Silver veins in the Cobalt, North Cobalt, Gowganda, South Lorrain and Casey Tp silver camps in Northeastern Ontario have extreme nugget effects in their envelopes of mineralization. Historically: before the days of 43-101 reporting, the miners had to have a strong vein or vein system with the appropriate mineralization, and hopefully a couple of ore grade intersections. When reasonable ore potential was established; it was cheaper to mine the deposit than to test the deposit by today’s 43-101 industry standards. It can be compared to grade calculating on the back of a cigarette package. In its day it was acceptable. This was exploration mining, the ultimate bulk sampling procedure.
If a grade of multiple silver veins as estimated on the basis of one or several holes in each vein; the sum of the estimates was reasonable for mine planning. However; If the high grade veins were selected for mining at the expense of the lower grade veins, it is unreasonable to count on the expected grades. When faced with this highgrading scenario it is more reasonable to doubling the tonnage for the expected silver content or to cut the grade by 50% for the calculated ore block.
Cutting Grades of Anomalously High Values
It is common practice of geologist to cut very high metal values to reasonable levels when calculating ore grade of ore blocks for mining purposes. This process is also used for calculating ore grades in stopes and for calculating grades of ore hoist to stock piles.
In the historic silver vein camps of NE Ontario; silver veins tended to be bimodal; with extremely high grade veins, generally greater than 3,000 troy ozAg/ton (102,857g/mT) sections and low grade sections that were actually waste.
If grade samples of the ore was collected at regular intervals, 5, 6 or 10 foot intervals the assays were far from representative of the ore grade of the exposed workings. Meaningful grades require artificial techniques known as cutting high grade values to artificial low values closer to the expected grade.
A more realistic approach calculating ore grade is to map the mine working as highgrade ore, low grade rock and very low grade rock. This author did this at the Beaver Temiskaming mine. The veins were generally less than 6 inches 15.2cm) wide with very little wall rock silver, See GSC publication “Geology of Canadian Mineral Deposit Types” page 294.
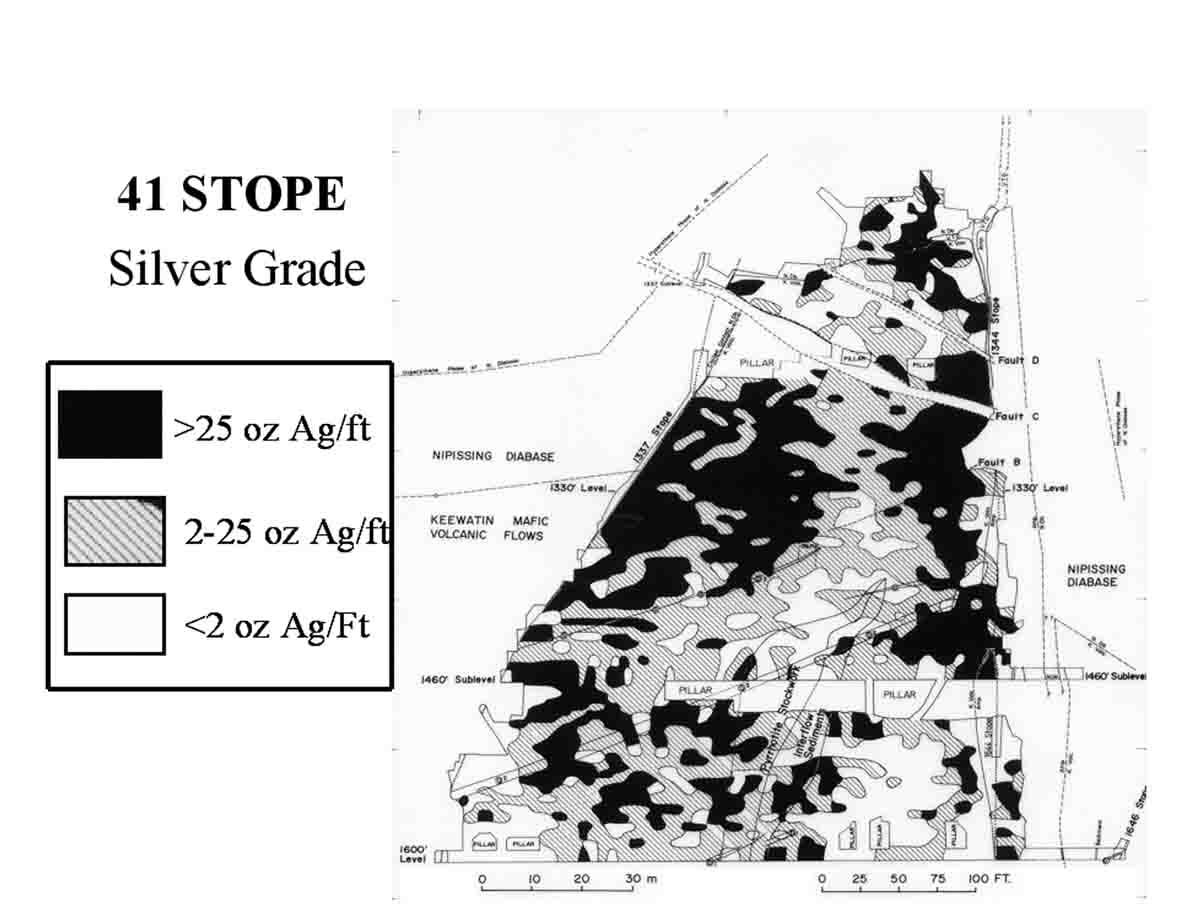
Figure Above: Beaver-Temiskaming Mine: 41 stope Beaver by this Author in “Geology of Canadian Mineral Deposit Types” and presented in CIM public meeting.
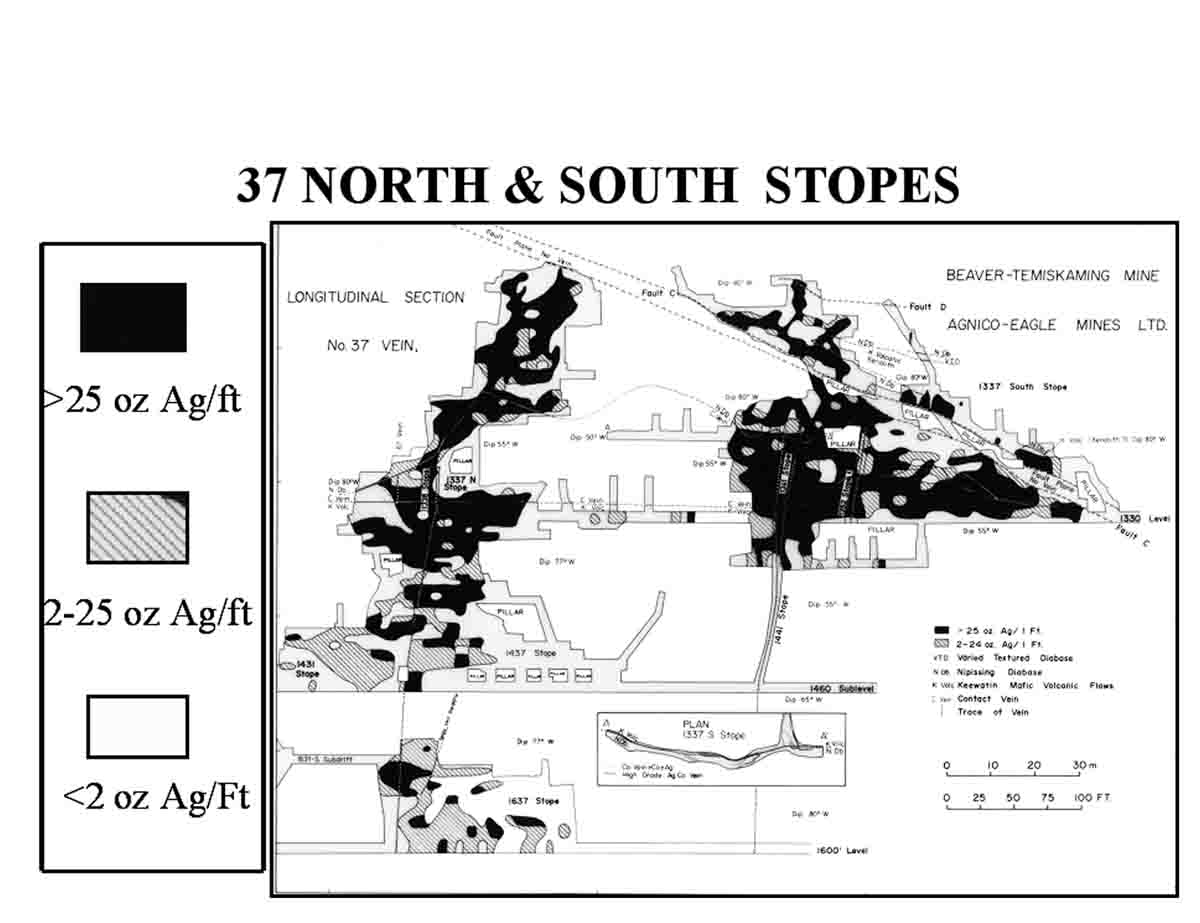
Figure Above: Beaver Temiskaming Mine: 37 Stope by this author and presented to CIM public meeting.
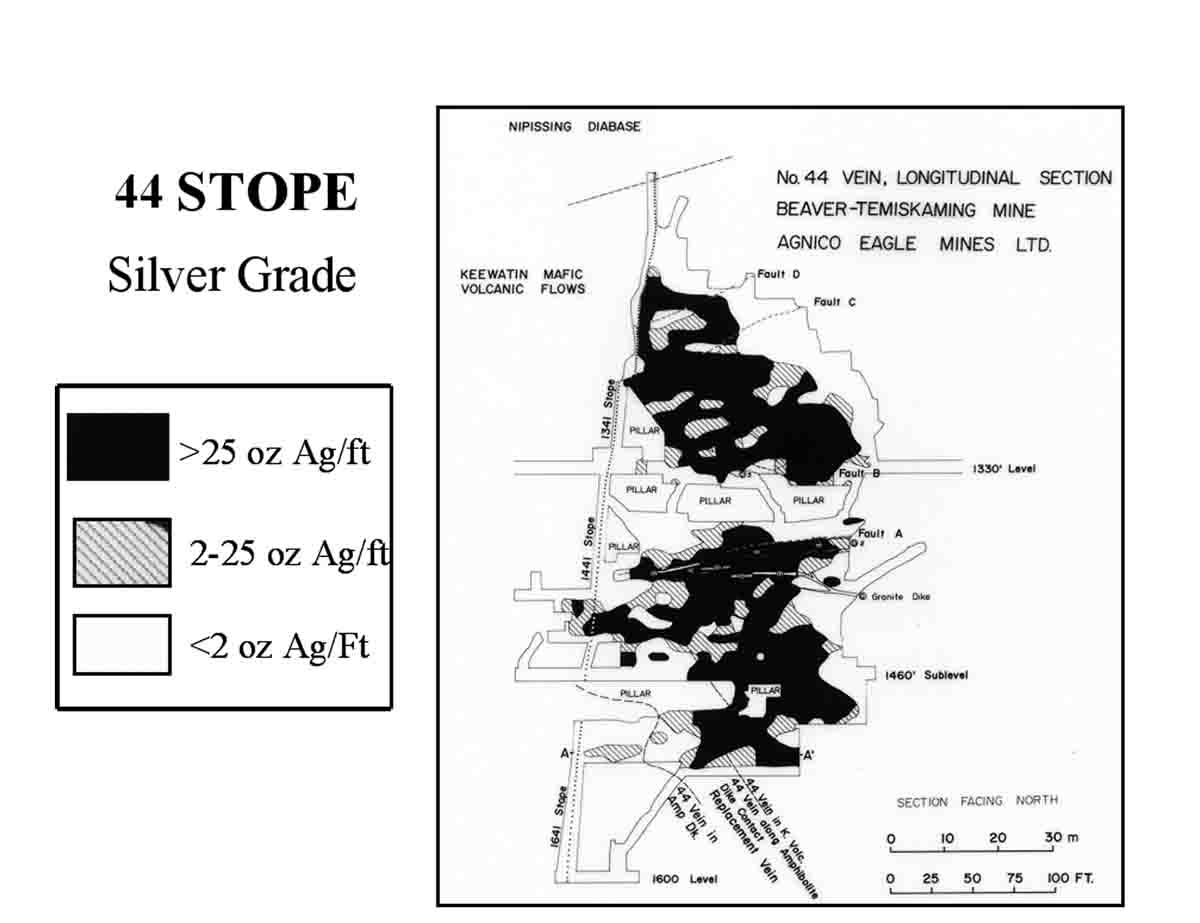
Figure Above: Beaver Temiskaming Mine: 44 Stope by this author and presented to CIM public meeting.
The veins were mapped as highgrade and low grade to barren. The high grade sections were divided into ten foot lengths and three 6 inch cuts of vein and wall rock were taken at approximately 2, 5 and 8 feet in this interval. The three cuts were combined as a single sample. If the high grade section was less than 10 feet long two similar cuts within that interval were mixed as a single sample. If the highgrade section was less than 5 feet long one cut was taken. This process was also performed on the low grade waste vein. THE calculated grade of the stope’s broken muck was calculated as individual blocks represented by the stope length represented by the sample. No cut of grades were used. The calculated stope grades were reliable and balanced well with the pulled/hoisted grade and mill heads (milled grade).
The normal process of calculating pulled /hoist grade is for the cage-tender to sample the ore cars at the shaft as they are hoisted. This would involve cutting the 60-500 ozAg/ton ore to 60 ozAg/ton, more than twice the average hoist grade. Some chutes had real grade of 400-500 oz Ag per ton. To cut the resulting pulled/hoisted grades would have resulted in artificially low grade and the pulled grades would not have balanced with the stope graders and mill head grades. Each train was sampled separately and credited to a stope area. This process established the grades were realistic and no cut of grade were used to calculate the hoist grade and ultimately the surface stockpile.
The surface stock pile grade was tracked and the hoist grades were reasonable without cutting. Over the space of several months the calculated grade of the ore piles would creep up or down and a small adjustment was made to maintain realistic grades for the mill man.
Blending Ore
Mills work best on a consistent grade for maximum recovery. Surges of high grade can result in overwhelming the process resulting in ore minerals going passing through the mill into tailings. Pulling ore from the stopes and shipping the ore directly to the mill can cause constant fluctuation of mill (head) grades that can be difficult to deal with. This problem can be caused by direct shipping from underground to the mill. In this situation the ore was stored in ore bins and trucked to the mill or the ore went directly to the mill. The logical solution to this is scheduling mining and pulling to even out the flow of regular and high grade ore. This is easier said than done in erratic ore deposits.
Many mines; including the Beaver-Temiskaming mine stockpiled their ore on surface. The ore cars were dumped in ore piles. The ore ran down the piles as thin layers with interspersed low, medium and high grade ore in this layers. This is similar to the growth of a volcano that is also built up in layers. From time to time the ore was trucked to the mill for milling. A front end loader indiscriminately dug the low, medium and high grade layers of ore. Loading and dumping the trucks efficiently mixed the ore grades resulting in a constant ore grade in the mill. At the Agnico Penn Mill the Beaver-Temiskaming ore was consistently 18-20 ozAg/ton. This was ideal for 97-98% silver recovery. This anomalously high recovery rate for metal ore was enhanced by having both gravity and floatation concentrations of ore. One extracted the ore that the other had trouble recovering. One could eat no fat and the other could eat no lean, and together they licked the silver platter clean.
At Silverfields mine, Hugh Moore had excellent control of daily shipping grades because of access to large stopes controlled the pull rates to blende regular ore naturally with sweetener ore to maintain consistent grade. This was an exception to the norm. Hughie’s intuitive approach to mining was important to putting Teck on the Mining Map of Canada.
Floating Cut-Off Grades
Some mining executive tend to think: One size fits all cut-off grade in the mine process. This is an artificial barrier to maximum extraction and absolute profitability of the ore body. It is also a disfavor to the community that the mine serves. A floating cutoff grade based on the principle of future costs and future revenue independent of past expenses is for realistic and better for the community.
An example off a floating cutoff grade is: 20ozAg/ton to develop a mine, a 10 oz/ton to develop a stope within a mine and a 5 oz/ton to continue mining in a stope. This is a floating cutoff grade that reflects the cost of developing a mine, the cost of developing a stope in a mine and the cost of blasting, hauling and milling ore from an existing stope. It is surprising how many people do not understand or recognizes this principle.
Definitions
Assay Ton: An assay ton is a weight of 29.166 + grams used in assaying, for convenience. The weight in milligrams of precious metal obtained from an assay ton of ore gives directly the number of ounces to the ton.
Crucible: A crucible is ceramic or metal container in which metals or other substances may be melted or subjected to very high temperatures.
Cupel: A cupel is a porous cup, often made of bone ash, used in assaying to separate precious metals from base elements such as lead. The lead is absorbed by the cupel leaving a precious metal bed.
.